|
|
|
|
11.0. Test Results |
|
|
|
|
|
11.0. Test Results |
|
 Figure 11.1a.
Test Circuit Diagram 1
Figure 11.1a.
Test Circuit Diagram 1
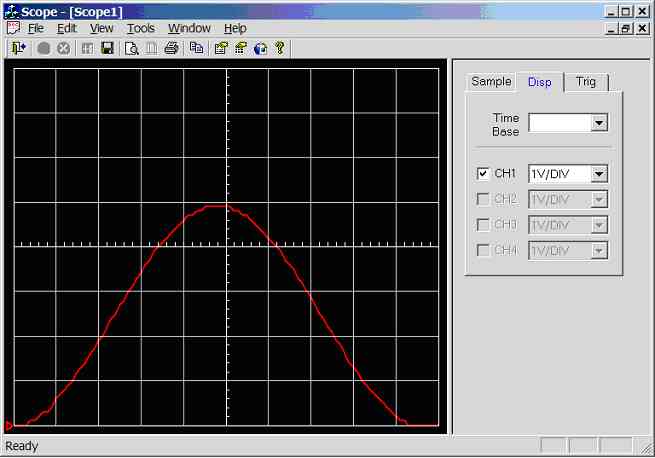 Figure 11.1.3a.
Screen dump of scope program (sample rate = 100Hz, input wave = 1Hz sinewave
0-5V)
2Hz
sinewave (0-5V) connected to CH1 (AN0), see figure 11.1.3b. 5 divisions per
cycle, hence the calculated frequency of this waveform is 1/(5 * 0.1) = 2Hz.
Figure 11.1.3a.
Screen dump of scope program (sample rate = 100Hz, input wave = 1Hz sinewave
0-5V)
2Hz
sinewave (0-5V) connected to CH1 (AN0), see figure 11.1.3b. 5 divisions per
cycle, hence the calculated frequency of this waveform is 1/(5 * 0.1) = 2Hz.
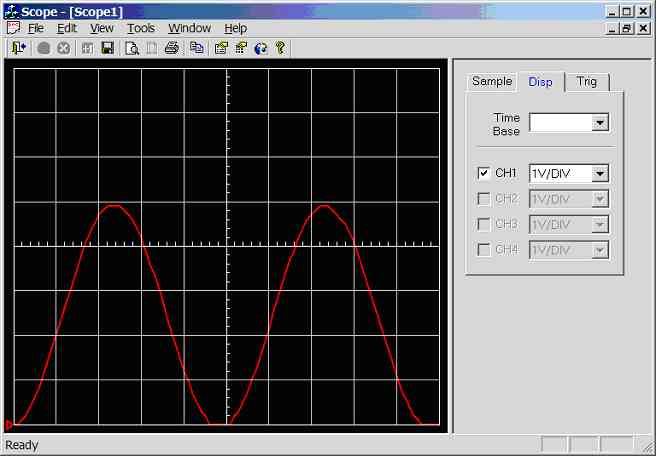 Figure 11.1.3b.
Screen dump of scope program (sample rate = 100Hz, input wave = 2Hz sinewave
0-5V)
5Hz
sinewave (0-5V) connected to CH1 (AN0), see figure 11.1.3c. 2 divisions per
cycle, Hence the calculated frequency of this waveform is 1/(2 * 0.1) = 5Hz.
Figure 11.1.3b.
Screen dump of scope program (sample rate = 100Hz, input wave = 2Hz sinewave
0-5V)
5Hz
sinewave (0-5V) connected to CH1 (AN0), see figure 11.1.3c. 2 divisions per
cycle, Hence the calculated frequency of this waveform is 1/(2 * 0.1) = 5Hz.
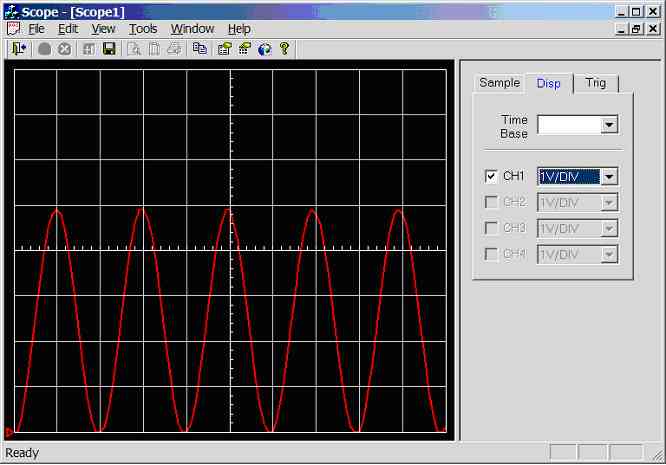 Figure 11.1.3c.
Screen dump of scope program (sample rate = 100Hz, input wave = 5Hz sinewave
0-5V)
10Hz
sinewave (0-5V) connected to CH1 (AN0), see figure 11.1.3d. 1 divisions per
cycle, hence the calculated frequency of this waveform is 1/(1 * 0.1) = 10Hz.
Figure 11.1.3c.
Screen dump of scope program (sample rate = 100Hz, input wave = 5Hz sinewave
0-5V)
10Hz
sinewave (0-5V) connected to CH1 (AN0), see figure 11.1.3d. 1 divisions per
cycle, hence the calculated frequency of this waveform is 1/(1 * 0.1) = 10Hz.
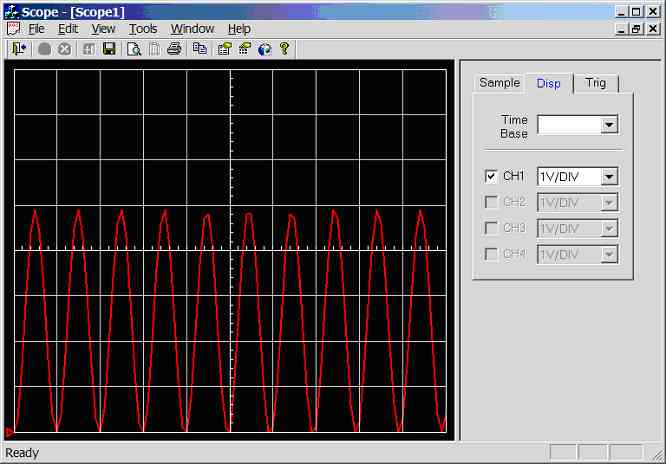 Figure 11.1.3d.
Screen dump of scope program (sample rate = 100Hz, input wave = 10Hz sinewave
0-5V)
20Hz
sinewave (0-5V) connected to CH1 (AN0), see figure 11.1.3e. 0.5 divisions per
cycle, hence the calculated frequency of this waveform is 1/(0.5 * 0.1) =
20Hz. But waveform is under sampled and heavily distorted, recall that the
pulse interpolator display type (scope.exe uses this) required at least 10
sample / cycle before a recognisable sinewave can be plotted.
Figure 11.1.3d.
Screen dump of scope program (sample rate = 100Hz, input wave = 10Hz sinewave
0-5V)
20Hz
sinewave (0-5V) connected to CH1 (AN0), see figure 11.1.3e. 0.5 divisions per
cycle, hence the calculated frequency of this waveform is 1/(0.5 * 0.1) =
20Hz. But waveform is under sampled and heavily distorted, recall that the
pulse interpolator display type (scope.exe uses this) required at least 10
sample / cycle before a recognisable sinewave can be plotted.
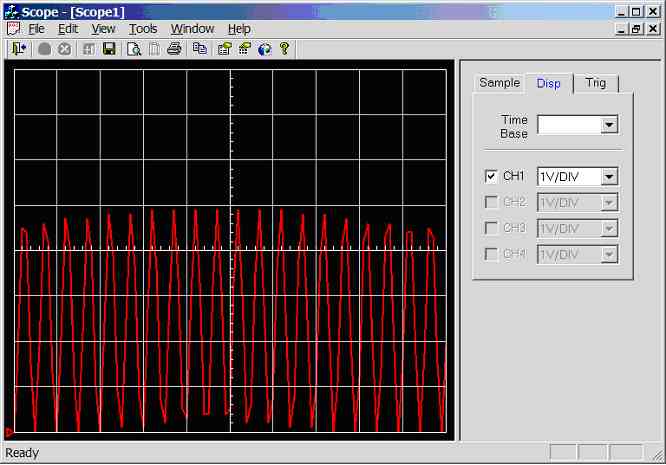 Figure 11.1.3e.
Screen dump of scope program (sample rate = 100Hz, input wave = 20Hz sinewave
0-5V)
50Hz
sinewave (0-5V) connected to CH1 (AN0), see figure 11.1.3f. Something real
strange has happened here, clearly the result of under sampling.
Figure 11.1.3e.
Screen dump of scope program (sample rate = 100Hz, input wave = 20Hz sinewave
0-5V)
50Hz
sinewave (0-5V) connected to CH1 (AN0), see figure 11.1.3f. Something real
strange has happened here, clearly the result of under sampling.
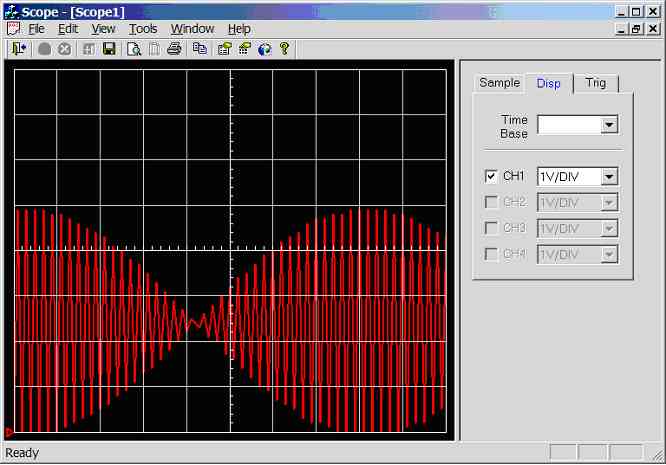 Figure 11.1.3f.
Screen dump of scope program (sample rate = 100Hz, input wave = 50Hz sinewave
0-5V)
100Hz
sine-wave (0-5V) connected to CH1 (AN0), see figure 11.1.3g. 10 divisions per
cycle, hence the calculated frequency of this waveform is 1/(10 * 0.1) = 1Hz.
Clearly not correct, the reason for this is that the sample rate is not high
enough and because sine-waves are periodical it is possible to get false
time-base readings (e.g. aliasing). This will be a mayor concern at a later
stage in the project, and will be investigated fully.
Figure 11.1.3f.
Screen dump of scope program (sample rate = 100Hz, input wave = 50Hz sinewave
0-5V)
100Hz
sine-wave (0-5V) connected to CH1 (AN0), see figure 11.1.3g. 10 divisions per
cycle, hence the calculated frequency of this waveform is 1/(10 * 0.1) = 1Hz.
Clearly not correct, the reason for this is that the sample rate is not high
enough and because sine-waves are periodical it is possible to get false
time-base readings (e.g. aliasing). This will be a mayor concern at a later
stage in the project, and will be investigated fully.
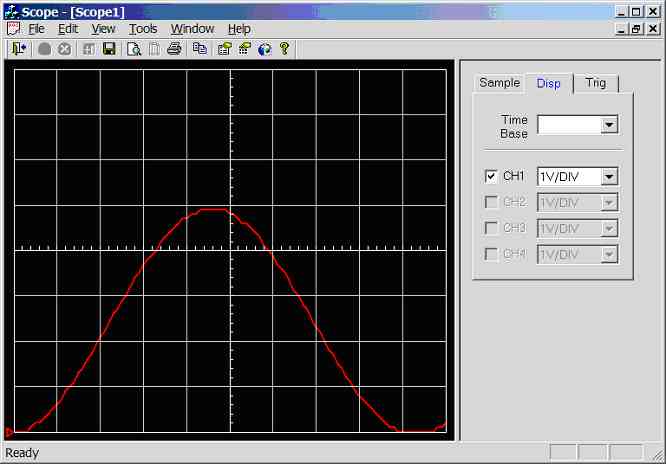 Figure 11.1.3g.
Screen dump of scope program (sample rate = 100Hz, input wave = 100Hz sinewave
0-5V)
200Hz
sinewave (0-5V) connected to CH1 (AN0), see figure 11.1.3h. 5 divisions per
cycle, hence the calculated frequency of this waveform is 1/(5 * 0.1) = 2Hz.
This signal is clearly an alias of the original signal (false signal).
Figure 11.1.3g.
Screen dump of scope program (sample rate = 100Hz, input wave = 100Hz sinewave
0-5V)
200Hz
sinewave (0-5V) connected to CH1 (AN0), see figure 11.1.3h. 5 divisions per
cycle, hence the calculated frequency of this waveform is 1/(5 * 0.1) = 2Hz.
This signal is clearly an alias of the original signal (false signal).
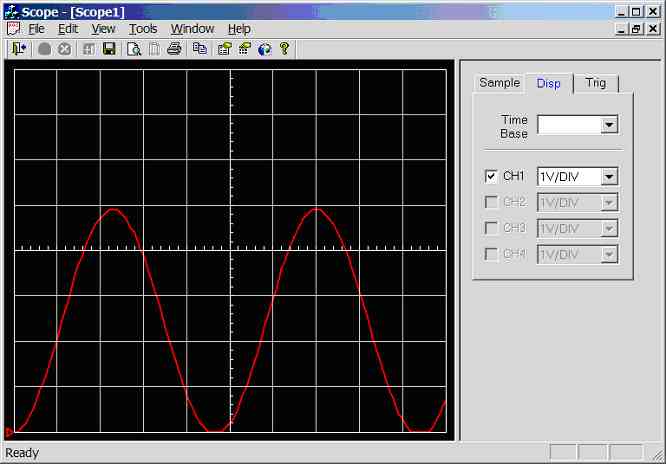 Figure 11.1.3h.
Screen dump of scope program (sample rate = 100Hz, input wave = 200Hz sinewave
0-5V)
Figure 11.1.3h.
Screen dump of scope program (sample rate = 100Hz, input wave = 200Hz sinewave
0-5V)
 Figure 11.2a.
Test Circuit Diagram 2
Figure 11.2a.
Test Circuit Diagram 2
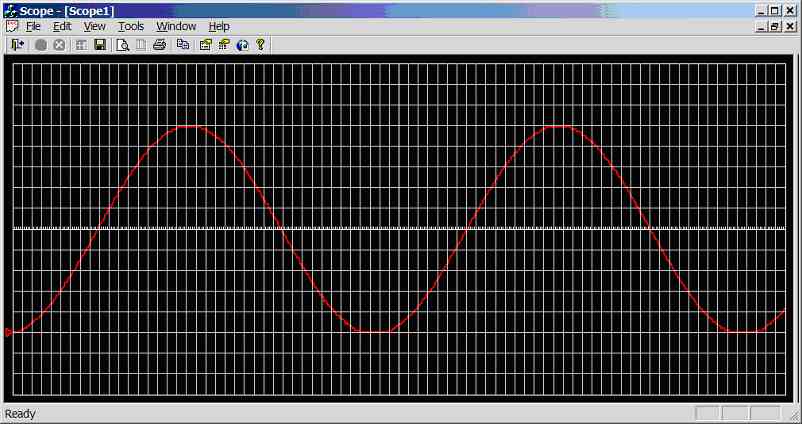 Figure 11.2.3a.
Screen dump of scope program (sample rate = 1,000Hz, input wave = 2.5Hz
sinewave 0-5V)
5Hz
sine-wave (0-5V) connected to CH1/AN0, see figure 11.2.3b (resolution 200 x
160, that’s 20 x 16 divisions), 19 division per cycle, hence the calculated
frequency of the waveform is 1/(19 * 0.01) = 5.26Hz.
Figure 11.2.3a.
Screen dump of scope program (sample rate = 1,000Hz, input wave = 2.5Hz
sinewave 0-5V)
5Hz
sine-wave (0-5V) connected to CH1/AN0, see figure 11.2.3b (resolution 200 x
160, that’s 20 x 16 divisions), 19 division per cycle, hence the calculated
frequency of the waveform is 1/(19 * 0.01) = 5.26Hz.
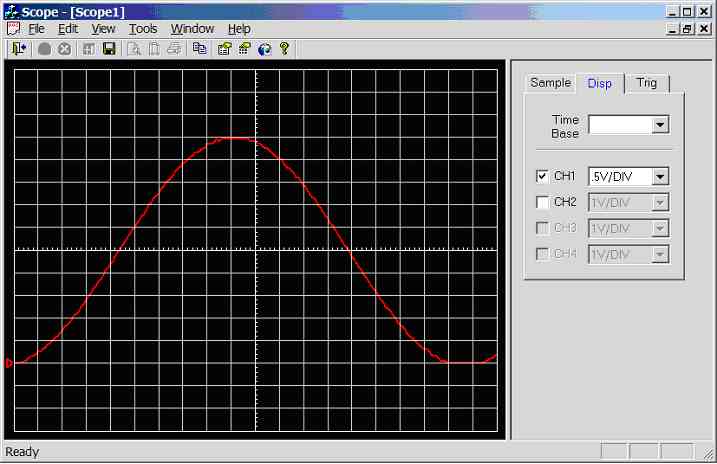 Figure 11.2.3b.
Screen dump of scope program (sample rate = 1,000Hz, input wave = 5Hz sinewave
0-5V)
10Hz
sinewave (0-5V) connected to CH1/AN0, see figure 11.2.3c (resolution 200 x
160, that’s 20 x 16 divisions), 10 division per cycle, hence the calculated
frequency of the waveform is 1/(10 * 0.01) = 10Hz.
Figure 11.2.3b.
Screen dump of scope program (sample rate = 1,000Hz, input wave = 5Hz sinewave
0-5V)
10Hz
sinewave (0-5V) connected to CH1/AN0, see figure 11.2.3c (resolution 200 x
160, that’s 20 x 16 divisions), 10 division per cycle, hence the calculated
frequency of the waveform is 1/(10 * 0.01) = 10Hz.
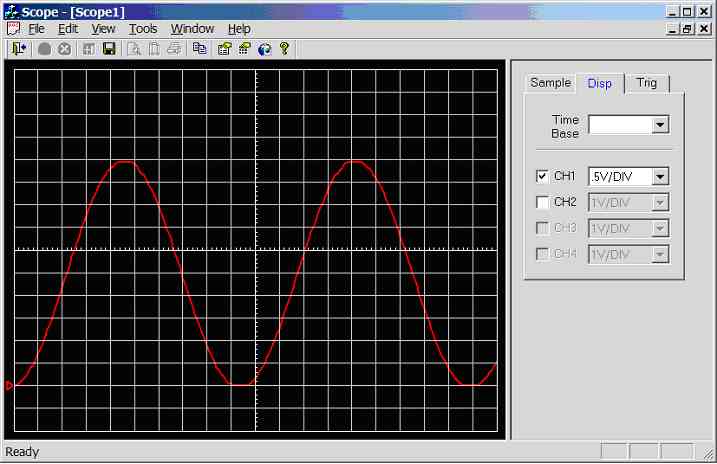 Figure 11.2.3c.
Screen dump of scope program (sample rate = 1,000Hz, input wave = 10Hz
sinewave 0-5V)
20Hz
sinewave (0-5V) connected to CH1/AN0, see figure 11.2.3d (resolution 200 x
160, that’s 20 x 16 divisions), 5 division per cycle, hence the calculated
frequency of the waveform is 1/(5 * 0.01) = 20Hz.
Figure 11.2.3c.
Screen dump of scope program (sample rate = 1,000Hz, input wave = 10Hz
sinewave 0-5V)
20Hz
sinewave (0-5V) connected to CH1/AN0, see figure 11.2.3d (resolution 200 x
160, that’s 20 x 16 divisions), 5 division per cycle, hence the calculated
frequency of the waveform is 1/(5 * 0.01) = 20Hz.
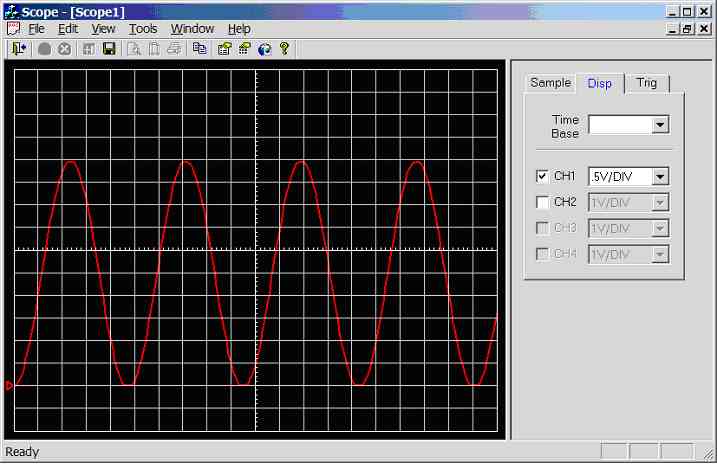 Figure 11.2.3d.
Screen dump of scope program (sample rate = 1,000Hz, input wave = 20Hz
sinewave 0-5V)
50Hz
sinewave (0-5V) connected to CH1/AN0, see figure 11.2.3e (resolution 200 x
160, that’s 20 x 16 divisions), 2 division per cycle, hence the calculated
frequency of the waveform is 1/(2 * 0.01) = 50Hz.
Figure 11.2.3d.
Screen dump of scope program (sample rate = 1,000Hz, input wave = 20Hz
sinewave 0-5V)
50Hz
sinewave (0-5V) connected to CH1/AN0, see figure 11.2.3e (resolution 200 x
160, that’s 20 x 16 divisions), 2 division per cycle, hence the calculated
frequency of the waveform is 1/(2 * 0.01) = 50Hz.
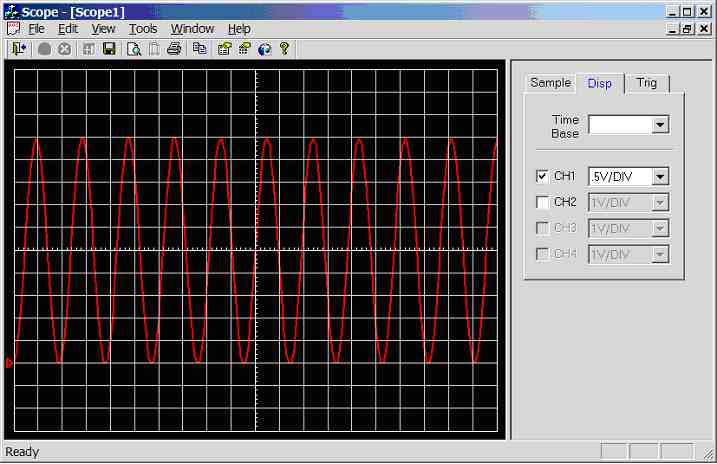 Figure 11.2.3e.
Screen dump of scope program (sample rate = 1,000Hz, input wave = 50Hz
sinewave 0-5V)
100Hz
sinewave (0-5V) connected to CH1/AN0, see figure 11.2.3f (resolution 100 x 80,
that’s 10 x 8 divisions), 1 division per cycle, hence the calculated frequency
of the waveform is 1/(1 * 0.01) = 100Hz.
Figure 11.2.3e.
Screen dump of scope program (sample rate = 1,000Hz, input wave = 50Hz
sinewave 0-5V)
100Hz
sinewave (0-5V) connected to CH1/AN0, see figure 11.2.3f (resolution 100 x 80,
that’s 10 x 8 divisions), 1 division per cycle, hence the calculated frequency
of the waveform is 1/(1 * 0.01) = 100Hz.
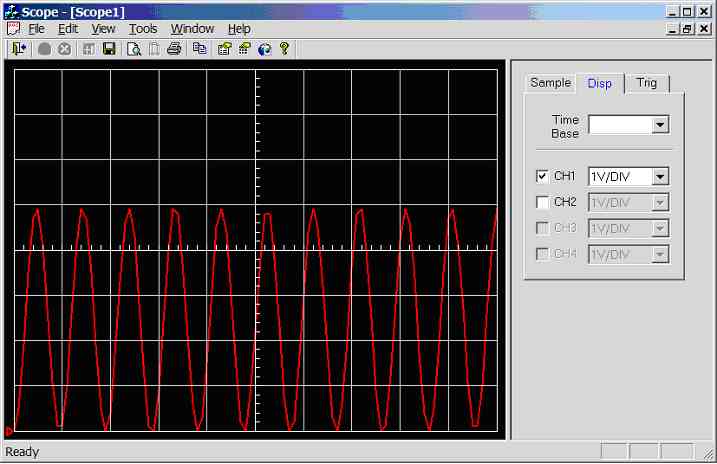 Figure 11.2.3f.
Screen dump of scope program (sample rate = 1,000Hz, input wave = 100Hz
sinewave 0-5V)
200Hz
sinewave (0-5V) connected to CH1/AN0, see figure 11.2.3g (resolution 100 x 80,
that’s 10 x 8 divisions), 0.5 divisions per cycle, hence the calculated
frequency of this waveform is 1/(0.5 * 0.01) = 200Hz. But waveform is under
sampled and heavily distorted, recall that the pulse interpolator display type
(scope.exe uses this) requires at least 10 sample / cycle before a
recognisable sine-wave can be plotted.
Figure 11.2.3f.
Screen dump of scope program (sample rate = 1,000Hz, input wave = 100Hz
sinewave 0-5V)
200Hz
sinewave (0-5V) connected to CH1/AN0, see figure 11.2.3g (resolution 100 x 80,
that’s 10 x 8 divisions), 0.5 divisions per cycle, hence the calculated
frequency of this waveform is 1/(0.5 * 0.01) = 200Hz. But waveform is under
sampled and heavily distorted, recall that the pulse interpolator display type
(scope.exe uses this) requires at least 10 sample / cycle before a
recognisable sine-wave can be plotted.
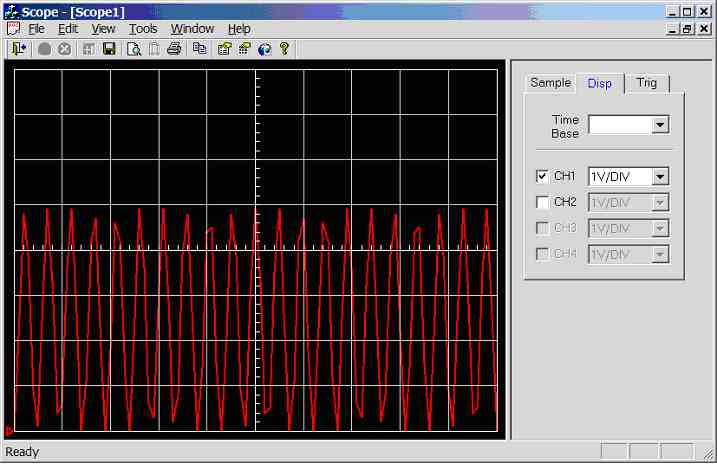 Figure 11.2.3g.
Screen dump of scope program (sample rate = 1,000Hz, input wave = 200Hz
sinewave 0-5V)
500Hz
sine-wave (0-5V) connected to CH1/AN0, see figure 11.2.3h (resolution 100 x
80, that’s 10 x 8 divisions), something real strange has happened here,
clearly the result of under sampling.
Figure 11.2.3g.
Screen dump of scope program (sample rate = 1,000Hz, input wave = 200Hz
sinewave 0-5V)
500Hz
sine-wave (0-5V) connected to CH1/AN0, see figure 11.2.3h (resolution 100 x
80, that’s 10 x 8 divisions), something real strange has happened here,
clearly the result of under sampling.
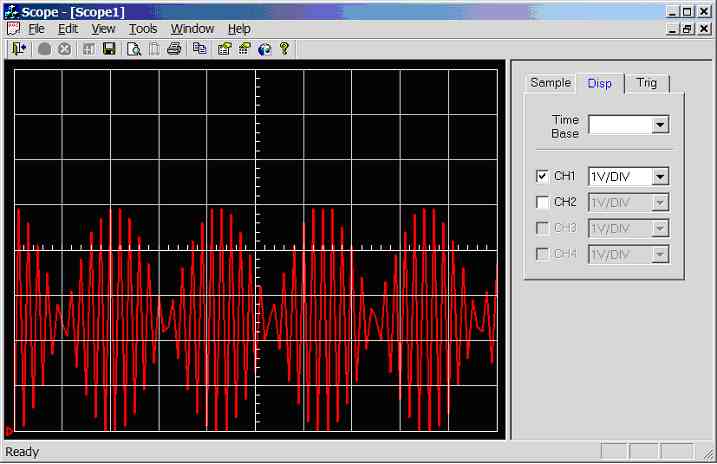 Figure 11.2.3h.
Screen dump of scope program (sample rate = 1,000Hz, input wave = 500Hz
sinewave 0-5V)
11.2.3.1. Sample Rate Changed to 2000Hz (mark6b.c)
Scope
time-base is 0.005 seconds per division that’s 200Hz.
10Hz
sinewave (0-5V) connected to CH1/AN0, see figure 11.2.3.1a (resolution 200 x
160, that’s 20 x 16 divisions), 19.5 division per cycle, hence the calculated
frequency of the waveform is 1/(19.5 * 0.005) = 10.25Hz.
Figure 11.2.3h.
Screen dump of scope program (sample rate = 1,000Hz, input wave = 500Hz
sinewave 0-5V)
11.2.3.1. Sample Rate Changed to 2000Hz (mark6b.c)
Scope
time-base is 0.005 seconds per division that’s 200Hz.
10Hz
sinewave (0-5V) connected to CH1/AN0, see figure 11.2.3.1a (resolution 200 x
160, that’s 20 x 16 divisions), 19.5 division per cycle, hence the calculated
frequency of the waveform is 1/(19.5 * 0.005) = 10.25Hz.
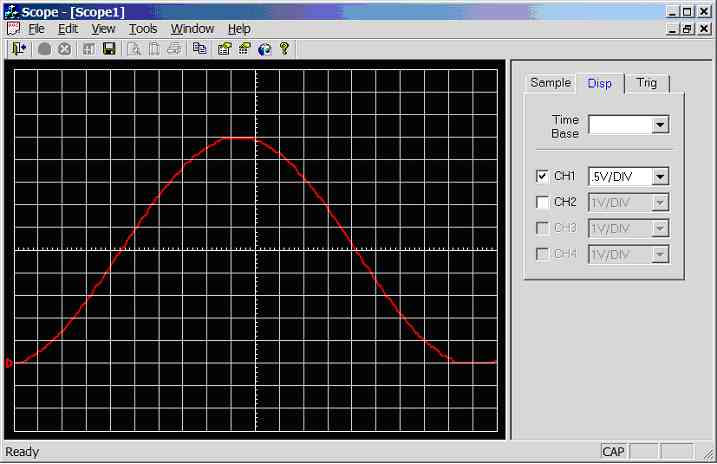 Figure 11.2.3.1a.
Screen dump of scope program (sample rate = 2,000Hz, input wave = 10Hz
sinewave 0-5V)
20Hz
sinewave (0-5V) connected to CH1/AN0, see figure 11.2.3.1b (resolution 200 x
160, that’s 20 x 16 divisions), 9.7 division per cycle, hence the calculated
frequency of the waveform is 1/(9.7 * 0.005) = 20.6Hz.
Figure 11.2.3.1a.
Screen dump of scope program (sample rate = 2,000Hz, input wave = 10Hz
sinewave 0-5V)
20Hz
sinewave (0-5V) connected to CH1/AN0, see figure 11.2.3.1b (resolution 200 x
160, that’s 20 x 16 divisions), 9.7 division per cycle, hence the calculated
frequency of the waveform is 1/(9.7 * 0.005) = 20.6Hz.
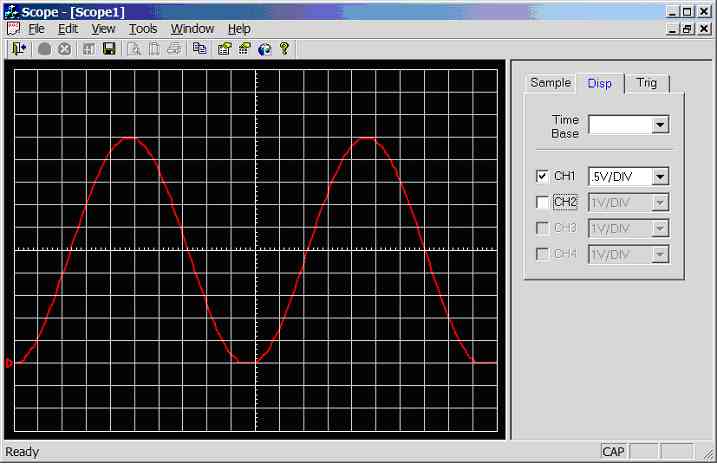 Figure 11.2.3.1b.
Screen dump of scope program (sample rate = 2,000Hz, input wave = 20Hz
sinewave 0-5V)
50Hz
sinewave (0-5V) connected to CH1/AN0, see figure 11.2.3.1c (resolution 200 x
160, that’s 20 x 16 divisions), 3.9 division per cycle, hence the calculated
frequency of the waveform is 1/(3.9 * 0.005) = 51.3Hz.
Figure 11.2.3.1b.
Screen dump of scope program (sample rate = 2,000Hz, input wave = 20Hz
sinewave 0-5V)
50Hz
sinewave (0-5V) connected to CH1/AN0, see figure 11.2.3.1c (resolution 200 x
160, that’s 20 x 16 divisions), 3.9 division per cycle, hence the calculated
frequency of the waveform is 1/(3.9 * 0.005) = 51.3Hz.
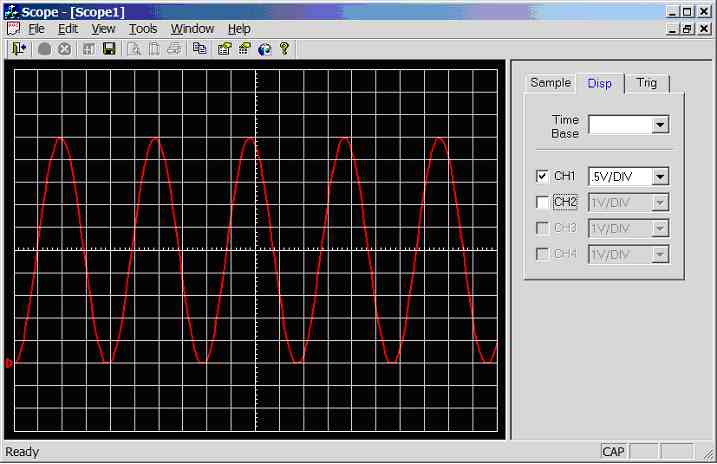 Figure 11.2.3.1c.
Screen dump of scope program (sample rate = 2,000Hz, input wave = 50Hz
sinewave 0-5V)
100Hz
sinewave (0-5V) connected to CH1/AN0, see figure 11.2.3.1d (resolution 200 x
160, that’s 20 x 16 divisions), 1.95 division per cycle, hence the calculated
frequency of the waveform is 1/(1.95 * 0.005) = 102.5Hz.
Figure 11.2.3.1c.
Screen dump of scope program (sample rate = 2,000Hz, input wave = 50Hz
sinewave 0-5V)
100Hz
sinewave (0-5V) connected to CH1/AN0, see figure 11.2.3.1d (resolution 200 x
160, that’s 20 x 16 divisions), 1.95 division per cycle, hence the calculated
frequency of the waveform is 1/(1.95 * 0.005) = 102.5Hz.
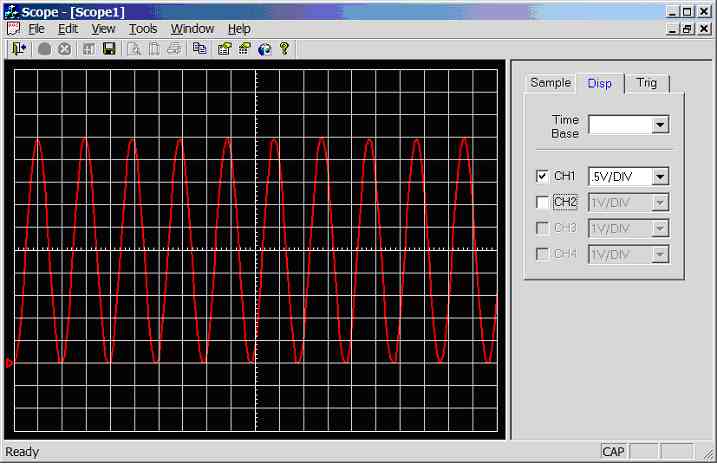 Figure 11.2.3.1d.
Screen dump of scope program (sample rate = 2,000Hz, input wave = 100Hz
sinewave 0-5V)
200Hz
sinewave (0-5V) connected to CH1/AN0, see figure 11.2.3.1e (resolution 100 x
80, that’s 10 x 8 divisions), 0.975 division per cycle, hence the calculated
frequency of the waveform is 1/(0.975 * 0.005) = 205Hz.
Figure 11.2.3.1d.
Screen dump of scope program (sample rate = 2,000Hz, input wave = 100Hz
sinewave 0-5V)
200Hz
sinewave (0-5V) connected to CH1/AN0, see figure 11.2.3.1e (resolution 100 x
80, that’s 10 x 8 divisions), 0.975 division per cycle, hence the calculated
frequency of the waveform is 1/(0.975 * 0.005) = 205Hz.
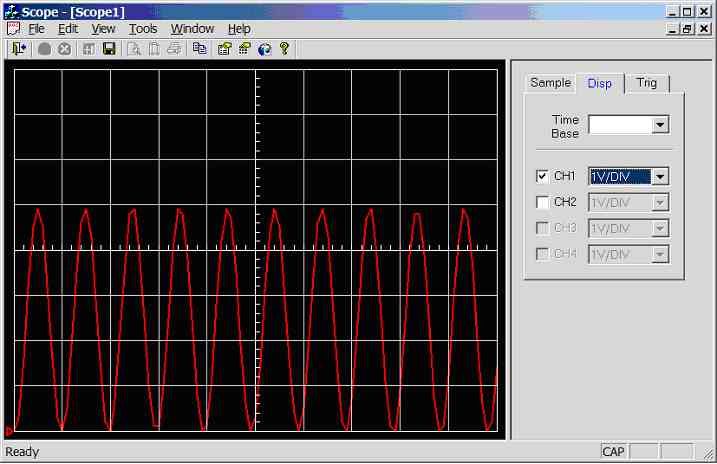 Figure 11.2.3.1f.
Screen dump of scope program (sample rate = 2,000Hz, input wave = 200Hz
sinewave 0-5V)
500Hz
sinewave (0-5V) connected to CH1/AN0, see figure 11.2.3.1g (resolution 100 x
80, that’s 10 x 8 divisions), clearly under sampled.
Figure 11.2.3.1f.
Screen dump of scope program (sample rate = 2,000Hz, input wave = 200Hz
sinewave 0-5V)
500Hz
sinewave (0-5V) connected to CH1/AN0, see figure 11.2.3.1g (resolution 100 x
80, that’s 10 x 8 divisions), clearly under sampled.
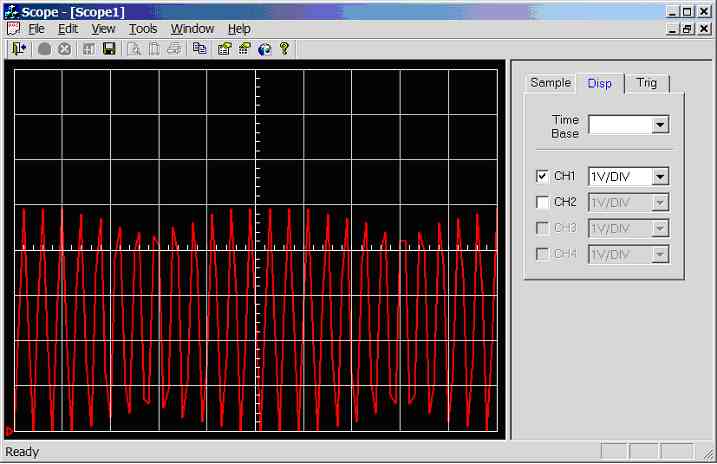 Figure 11.2.3.1g.
Screen dump of scope program (sample rate = 2,000Hz, input wave = 500Hz
sinewave 0-5V)
1,000Hz sinewave (0-5V) connected to CH1/AN0, see figure 11.2.3.1h (resolution
100 x 80, that’s 10 x 8 divisions), something real strange has happened here,
clearly the result of under sampling.
Figure 11.2.3.1g.
Screen dump of scope program (sample rate = 2,000Hz, input wave = 500Hz
sinewave 0-5V)
1,000Hz sinewave (0-5V) connected to CH1/AN0, see figure 11.2.3.1h (resolution
100 x 80, that’s 10 x 8 divisions), something real strange has happened here,
clearly the result of under sampling.
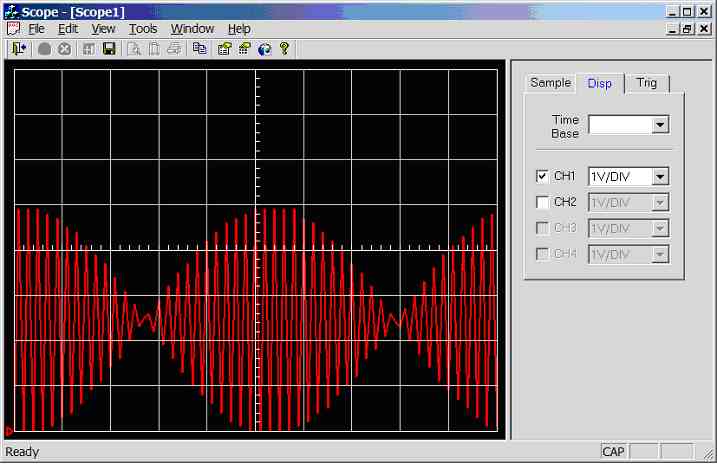 Figure 11.2.3.1h.
Screen dump of scope program (sample rate = 2,000Hz, input wave = 1,00Hz
sinewave 0-5V)
20Hz
trianglewave (0-5V) connected to CH1/AN0, see figure 11.2.3.1i (resolution 200
x 160, that’s 20 x 16 divisions), 9.9 division per cycle, hence the calculated
frequency of the waveform is 1/(9.9 * 0.005) = 20.2Hz.
Figure 11.2.3.1h.
Screen dump of scope program (sample rate = 2,000Hz, input wave = 1,00Hz
sinewave 0-5V)
20Hz
trianglewave (0-5V) connected to CH1/AN0, see figure 11.2.3.1i (resolution 200
x 160, that’s 20 x 16 divisions), 9.9 division per cycle, hence the calculated
frequency of the waveform is 1/(9.9 * 0.005) = 20.2Hz.
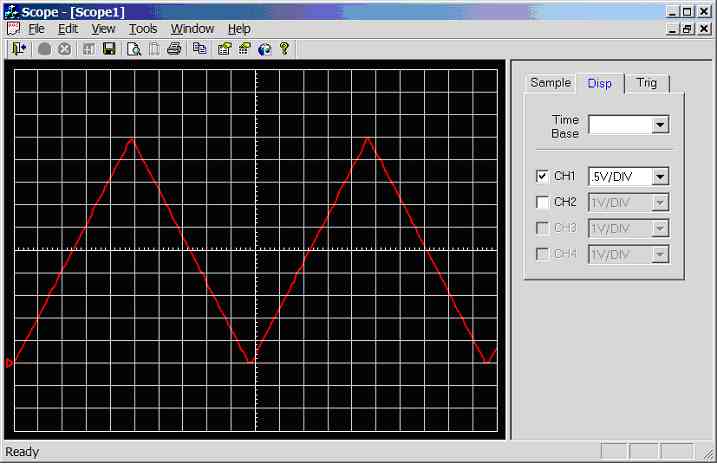 Figure 11.2.3.1i.
Screen dump of scope program (sample rate = 2,000Hz, input wave = 20Hz
trianglewave 0-5V)
20Hz
squarewave (0-5V) connected to CH1/AN0, see figure 11.2.3.1j (resolution 200 x
160, that’s 20 x 16 divisions), 9.9 division per cycle, hence the calculated
frequency of the waveform is 1/(9.9 * 0.005) = 20.2Hz.
Figure 11.2.3.1i.
Screen dump of scope program (sample rate = 2,000Hz, input wave = 20Hz
trianglewave 0-5V)
20Hz
squarewave (0-5V) connected to CH1/AN0, see figure 11.2.3.1j (resolution 200 x
160, that’s 20 x 16 divisions), 9.9 division per cycle, hence the calculated
frequency of the waveform is 1/(9.9 * 0.005) = 20.2Hz.
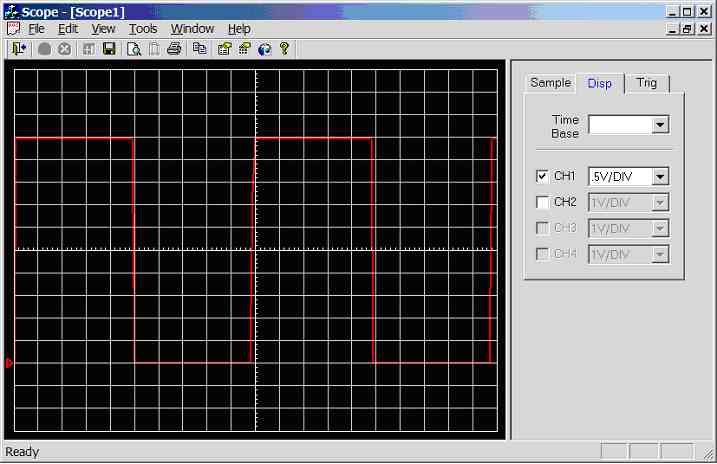 Figure 11.2.3.1j.
Screen dump of scope program (sample rate = 2,000Hz, input wave = 20Hz
squarewave 0-5V)
11.2.3.2. Sample rate changed to 5000Hz (mark6c.c)
Hence
scope time-base is 0.002 seconds per division that’s 500Hz.
50Hz
sinewave (0-5V) connected to CH1/AN0, see figure 11.2.3.2a (resolution 200 x
160, that’s 20 x 16 divisions), 8 division per cycle, hence the calculated
frequency of the waveform is 1/(8 * 0.002) = 62.5Hz. Clearly something bad has
happed here; there are gaps in the data. The reason for this is that the UART
transmit buffer fills up and the program must wait until the transmit buffer
is free to accepted another character; hence there is an additional time
delay.
Figure 11.2.3.1j.
Screen dump of scope program (sample rate = 2,000Hz, input wave = 20Hz
squarewave 0-5V)
11.2.3.2. Sample rate changed to 5000Hz (mark6c.c)
Hence
scope time-base is 0.002 seconds per division that’s 500Hz.
50Hz
sinewave (0-5V) connected to CH1/AN0, see figure 11.2.3.2a (resolution 200 x
160, that’s 20 x 16 divisions), 8 division per cycle, hence the calculated
frequency of the waveform is 1/(8 * 0.002) = 62.5Hz. Clearly something bad has
happed here; there are gaps in the data. The reason for this is that the UART
transmit buffer fills up and the program must wait until the transmit buffer
is free to accepted another character; hence there is an additional time
delay.
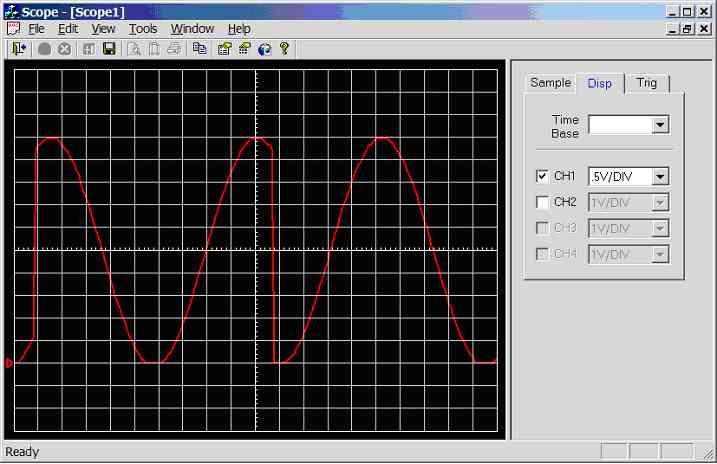 Figure 11.2.3.2a.
Screen dump of scope program (sample rate = 5,000Hz, input wave = 50Hz
squarewave 0-5V)
This
program reads the ADC and transmits two characters with a 200µS delay before
the process repeats over and over again. But if the transmits buffer is full,
note that for 115kbps it takes 8.7µs (1/115,000) to transmit each character
that’s 86.9µS per byte. Using the PICs built in timers should fix this
problem.
But
the main reason for the distorted waveform was because the PC serial buffer
was overflowing. The incoming characters were coming in faster than the scope
program was processing them hence the buffer was overflowing, causing gaps to
appear in the data. The solution is to increase the scope programs
communication protocol real-time timer (e.g. from 100ms to 25ms), and increase
the buffer size (from 1k to 10k).
Figure 11.2.3.2a.
Screen dump of scope program (sample rate = 5,000Hz, input wave = 50Hz
squarewave 0-5V)
This
program reads the ADC and transmits two characters with a 200µS delay before
the process repeats over and over again. But if the transmits buffer is full,
note that for 115kbps it takes 8.7µs (1/115,000) to transmit each character
that’s 86.9µS per byte. Using the PICs built in timers should fix this
problem.
But
the main reason for the distorted waveform was because the PC serial buffer
was overflowing. The incoming characters were coming in faster than the scope
program was processing them hence the buffer was overflowing, causing gaps to
appear in the data. The solution is to increase the scope programs
communication protocol real-time timer (e.g. from 100ms to 25ms), and increase
the buffer size (from 1k to 10k).
This Web Page was last updated on Friday June 28, 2002
Home About me National Record Of Achievement Hobbies / Interests Guest Book Contact Me Links Snooker Amateur Radio Site Map
|
© 2002 Designed by Colin K McCord |
|
This website is best viewed by Microsoft Internet Explorer 6.0 at a resolution of 1024 x 768